
What Is CFS? River Flow Data Guide for Fishing & Floating
Quick Reference
| Flow Trend | What It Means | Best Action |
|---|---|---|
| Rising rapidly | Storm runoff or dam release, visibility dropping | Wait it out, fish elsewhere |
| Rising slowly | Snowmelt increasing | Monitor closely, may have 1-2 fishable days |
| Stable | Consistent conditions | Go fish - most reliable conditions |
| Falling slowly | Post-peak, water clearing | Prime time - fish are hungry |
| Falling rapidly | Drought or dam cutoff | Fish deeper pools, expect spooky trout |
Key Principle: CFS numbers mean nothing without context. 500 CFS is a trickle on the Yellowstone but a flood on a small creek. Learn your specific rivers.
What Is CFS and Why Should You Care?
You're standing at a trailhead, checking your phone one last time before hitting the water. The river gauge shows 847 CFS. Is that good? Bad? Should you even bother rigging up?
CFS stands for Cubic Feet per Second - the volume of water passing a specific point in one second. Picture a cube one foot tall, one foot wide, and one foot deep (about the size of a basketball). That cube holds 7.48 gallons. One CFS means one of those cubes passes the gauge every second.
At 100 CFS, roughly 750 gallons flow past per second. At 1,000 CFS, that jumps to 7,480 gallons per second. At 10,000 CFS, you're looking at 74,800 gallons rushing by every second - roughly the volume of a typical residential swimming pool every two seconds.
But here's what matters to you on the water: CFS directly affects safety, fish behavior, and whether you'll have a good day or a frustrating one. The same river at 300 CFS and 1,500 CFS might as well be two different rivers. Understanding flow data transforms guesswork into informed decisions.
A Tale of Two Rivers
I learned this lesson the hard way years ago. Checked the gauge on the Arkansas near Salida - 1,400 CFS. "That's fine," I thought, having fished the Yellowstone plenty of times at similar flows. Showed up to find a raging torrent of brown water that would've swept me downstream in seconds. The Arkansas at 1,400 CFS during summer recreational releases is a completely different animal than the Yellowstone at 1,400 CFS in September.
A month later, I checked the Yellowstone at Livingston showing 8,500 CFS - a number that would mean certain death on most Colorado rivers. But on that big Montana water, it was just coming into shape after runoff. We floated the Paradise Valley stretch and caught fish all day on attractor dries.
Same numbers. Completely different realities. That's why context matters more than the number itself.
The Two Key Measurements
River gauges report two related but different numbers. Knowing which to watch helps you make better plans.
CFS (Cubic Feet per Second)
CFS measures volume - how much water is moving. It's calculated by multiplying the river's width, depth, and current speed at the gauge location.
Strengths:
- Standardized measurement across all gauges
- Directly indicates water power and volume
- Most common measurement for Western rivers
Limitations:
- The same CFS reading means different things on different rivers
- Doesn't directly tell you depth at your fishing spot
- Gauge may be miles from where you're fishing
Gauge Height (Stage)
Gauge height measures depth at the gauge station - how high the water is relative to a fixed reference point. It's reported in feet.
Strengths:
- Directly indicates water depth at the gauge
- Easy to visualize
- Some anglers find it more intuitive
Limitations:
- Reference points vary between gauges
- A "3-foot stage" on one river tells you nothing about another
- Less commonly used in the West (more popular in the Midwest and East)
Which Should You Use?
For most purposes, CFS is more useful because it indicates overall water volume. But the truth is, both numbers become meaningful only after you've fished a river at different levels and learned what those numbers feel like.
A veteran Madison River angler might say "I like it around 1,000 CFS." A guide on the Green River might prefer "around 1,200 at the Dutch John gauge." Both are expressing the same concept - optimal conditions they've learned through experience.
Verified Flow Ranges for Popular Rivers
Generic guidelines only get you so far. Here are specific, verified flow ranges for rivers anglers actually fish, gathered from local fly shops, outfitters, and years of on-the-water experience.
Colorado Rivers
South Platte River - Deckers/Cheesman Canyon
The South Platte is Colorado's most technical tailwater. Flow varies based on releases from Cheesman Reservoir.
| CFS | Conditions | Notes |
|---|---|---|
| 80-120 | Very low | Winter baseflows, technical fishing, approach carefully |
| 150-250 | Optimal | Best wading, excellent visibility, fish accessible |
| 250-400 | Good | Still wadeable, slightly more water to cover |
| 400-600 | High | Challenging wading, fish the edges |
| 600+ | Too high | Unfishable for most, wait for it to drop |
Local tip: Winter flows typically run 100-150 CFS. In fall, 212 CFS is considered excellent - wadeable, clear, and trout-friendly. Check South Platte flows at Deckers before you go.
Arkansas River - Salida/Browns Canyon
The Arkansas is Colorado's most popular rafting river, which means summer flows are augmented for recreation. This creates two distinct fishing seasons.
| Season | CFS Range | Best For |
|---|---|---|
| Winter/Spring (Oct-May) | 225-400 | Wade fishing, lower sections |
| Summer Rec Flows (Jun-Aug 15) | 700-1,500 | Float fishing only |
| Fall Sweet Spot (Aug 15-Oct) | 250-350 | Prime wade fishing |
Critical dates: August 15th is when augmented flows for rafting end. The river drops from 700+ CFS to 250-350 CFS within days. If you want to wade the Arkansas, plan your trip for late August through October.
Gauge note: The Wellsville gauge is the reference for the Salida stretch. Locals consider 330 CFS ideal, with 385 CFS as the upper limit for comfortable wading. Track Arkansas River flows at Salida for current conditions.
Upper Colorado River - State Bridge to Dotsero
Big water that requires understanding.
| CFS | Conditions | Activity |
|---|---|---|
| 800-1,500 | Optimal | Excellent wading and floating |
| 1,500-2,500 | Higher | Good float fishing, limited wading |
| 2,500-4,000 | High | Float only, experienced rowers |
| 4,000+ | Runoff | Unfishable until it drops |
Post-runoff timing: Wait until the river drops below 2,000 CFS after spring runoff ends - typically late June in average years, early July in big snowpack years. See Colorado River flows near Kremmling for current readings.
Montana Rivers
Madison River
The Madison is Montana's most famous wade-and-float fishery. Those bowling-ball boulders demand respect at any flow.
| CFS | Conditions | Notes |
|---|---|---|
| 700-900 | Low | Excellent wading, technical floating |
| 1,000-1,300 | Ideal | Best compromise for wading and floating |
| 1,300-1,800 | Higher | Difficult wading, good float |
| 1,800-2,500 | High | Float only, watch Wolf Creek Bridge clearance |
| 2,500-4,000 | Very high | Experienced floaters only |
| 4,000+ | Dangerous | Low bridges become impassable |
Monitor Madison River flows near Cameron before planning your trip.
Critical hazard: Wolf Creek Bridge has low clearance. At flows exceeding 2,500 CFS, navigation becomes hazardous. Some anglers have died here. Know the bridge locations and current flows before launching.
Wading reality: Even at "optimal" flows, wading the Madison isn't for the faint of heart. Those large boulders combined with fast current require a wading staff and solid balance. Fish certain sections float-only if you're not confident in heavy current.
Yellowstone River - Paradise Valley
Montana's biggest freestone requires recalibrating your sense of what's "high" and "low."
| CFS | Conditions | Best Sections |
|---|---|---|
| 3,000-5,000 | Low | Point of Rocks becomes accessible |
| 5,000-8,000 | Good | Paradise Valley floats, some wading |
| 8,000-10,000 | Coming into shape | Nymphing and streamers productive |
| 10,000-15,000 | High but fishable | Attractor dries can work |
| 15,000+ | Very high | Post-runoff, wait for it to drop |
Timing context: The Yellowstone first produces reliably good fishing when flows hit 10,000 CFS as runoff subsides - usually late June or early July. In drought years, it can clear in mid-June. In big snow years, high water can extend into mid-July. Check Yellowstone flows near Livingston for current readings.
Section-specific: The town stretch near Livingston fishes best below 7,000 CFS due to higher gradient. Point of Rocks floats are best once the river drops below 4,000 CFS.
Bighorn River - Fort Smith
Montana's premier tailwater averages 150-250 feet wide with consistent dam-controlled flows.
| CFS | Conditions | Notes |
|---|---|---|
| 1,500-2,500 | Lower range | Excellent wading opportunities |
| 2,000-3,500 | Optimal | Prime conditions |
| 3,500-5,000 | Higher | Still very fishable |
| 5,000-7,000 | High | June/July releases, float recommended |
| 7,000+ | Peak releases | Wait for August drop |
Seasonal pattern: If flows follow historical patterns - peaking above 7,000 CFS in June then gradually decreasing to around 3,000 CFS by August 1st - then August is the most consistent late-summer fishing on the Bighorn.
Utah Rivers
Green River - Flaming Gorge (A, B, C Sections)
Utah's most famous tailwater has section-specific optimal flows.
| CFS | A Section | B & C Sections |
|---|---|---|
| 800-1,000 | Excellent | Good |
| 1,200-1,600 | Good | Excellent |
| 1,600-2,000 | Swift, challenging | Very good |
| 2,000-2,500 | Technical | Good |
| 2,500+ | Difficult | Fair |
Section considerations: The A Section (immediately below the dam) is swifter and more technical. At 1,980 CFS, A Section can be challenging while B and C Sections fish beautifully. Plan your section choice based on current flows.
High water timing: High water typically starts between May 20-25 and lasts 2-4 weeks, with flows sometimes exceeding 4,600 CFS during peak releases.
Idaho Rivers
Henry's Fork - Box Canyon/Island Park
Technical water that demands attention to flows.
| CFS | Conditions | Tactics |
|---|---|---|
| 300-500 | Low | Challenging, fish pressured |
| 600-850 | Optimal | Good nymphing, evening streamer action |
| 850-1,200 | Higher | Adjust presentations, fish soft water |
| 1,200-1,400 | High | During Salmonfly hatch, manageable |
| 1,400+ | Very high | Difficult fishing |
Box Canyon specifics: At 780 CFS, nymphing produces in the morning and streamers work evenings. At 643 CFS, fishing gets tougher - you'll need rubber legs and small midges, and patience.
Water Temperature: The Other Critical Variable
Flow data tells you how much water is moving. Temperature tells you whether fish can survive your catching them. Ignoring temperature can kill trout - literally.
Why Temperature Matters
Trout are cold-water fish that thrive between 50-65°F. Their metabolism, feeding activity, and ability to recover from stress all depend on water temperature:
| Temperature | Trout Response |
|---|---|
| 45-50°F | Sluggish, slower metabolism, reduced feeding |
| 50-60°F | Optimal - active feeding, strong fight, quick recovery |
| 60-65°F | Active but starting to stress, handle quickly |
| 65-68°F | Stressed, recovery compromised, fish carefully |
| 68-70°F | High stress, stop fishing if possible |
| 70-73°F | Dangerous - mortality rates climb sharply |
| 73°F+ | Potentially lethal - stop fishing immediately |
The science: Warm water holds less dissolved oxygen. Above 68°F, trout have to work harder to breathe while simultaneously dealing with elevated metabolism. Fighting an angler in these conditions can push them past the point of recovery.
Hoot Owl Restrictions
When water temperatures remain above 73°F for three consecutive days, Montana Fish, Wildlife & Parks implements "Hoot Owl" restrictions - afternoon fishing closures from 2pm to midnight.
Why "Hoot Owl"? You can fish when the owls are hooting - early morning when temperatures are lowest.
Where they apply: These restrictions have been used across Montana since 2013, with similar programs in Idaho, Colorado, and other states. They're triggered by a combination of low flows and high temperatures.
Checking restrictions: Before fishing Montana in July or August, check current restrictions on the FWP website. Rivers commonly affected include the Big Hole, Beaverhead, Jefferson, and even sections of the Madison and Yellowstone during severe drought years.
Temperature and Flow Interaction
Low flows and high temperatures compound each other:
- Low flow + cool temps: Technical but fishable - approach carefully
- Normal flow + cool temps: Ideal conditions
- Normal flow + warm temps: Fish early and late, monitor conditions
- Low flow + warm temps: Dangerous for fish - consider staying home
- High flow + any temp: Focus on flow; temp less critical when water is moving fast
Practical application: During summer, check both flow AND temperature before heading out. If afternoon temps will exceed 65°F, plan to be off the water by early afternoon. Some of the best summer fishing happens at dawn when temps are lowest.
Tailwater Rivers: A Different Game
Dam-controlled tailwaters follow completely different rules than freestone rivers. Understanding these patterns can save you from wasted trips - or help you find fishable water when everything else is blown.
Why Tailwaters Are Different
Water released from the bottom of reservoirs is cold (often 45-55°F year-round) and flow is controlled by dam operations, not weather. This creates:
- Stable temperatures: Fish aren't stressed by summer heat
- Consistent flows: Less dependent on snowmelt and rain
- Predictable patterns: Releases often follow daily or weekly schedules
- Year-round fishing: Many tailwaters fish well in winter when freestones are locked up
Reading the Sawtooth Pattern
Many tailwaters show a distinctive "sawtooth" flow pattern - daily spikes followed by drops as the dam releases water for power generation or downstream needs.
Typical pattern:
- Low flows overnight and early morning
- Rising flows through midday
- Peak flows late afternoon/evening
- Falling flows after sunset
Fishing implications:
- Best window: Early morning before releases ramp up
- Challenging: During rapid rise - fish are adjusting
- Second window: Late evening as flows stabilize or fall
Example - Lees Ferry (Colorado River below Glen Canyon Dam): Flows range from around 8,900-14,275 CFS depending on releases. The 1991 implementation of more stable flow regimes has increased fish survival but also increased competition, resulting in somewhat smaller average fish size. Check the Glen Canyon Dam release schedule before planning your trip.
Tailwaters as Backup Plans
When your target freestone is blown out from runoff or storms, check nearby tailwaters:
| Situation | Tailwater Option |
|---|---|
| Arkansas blown from Front Range storms | South Platte below Cheesman |
| Madison running high and dirty | Missouri below Holter Dam |
| Yellowstone unfishable in June | Bighorn at Fort Smith |
| Colorado freestones in runoff | Green River below Flaming Gorge |
This is why experienced anglers always have a tailwater backup in their planning.
Understanding Historical Averages
Raw CFS numbers don't tell the whole story. You need context: is today's reading normal for this time of year, or is the river running unusually high or low?
The Median Line
Most flow charts display a historical median - the typical flow for that date based on decades of data. On RiverReports, you can view this as a reference line on the chart.
Reading the comparison:
| Current vs. Median | What It Suggests |
|---|---|
| 80-120% of median | Normal conditions for the season |
| 50-80% of median | Below average - may be running low |
| Below 50% of median | Drought conditions - extreme low water |
| 120-150% of median | Above average - higher than typical |
| Above 150% of median | High water event - runoff or storm |
Why This Matters
A river running at 1,200 CFS in June might be:
- Perfectly normal if the median is 1,100 CFS
- Dangerously high if the median is 400 CFS
- Surprisingly low if the median is 2,500 CFS
Always check current flow against historical averages before deciding whether conditions are favorable.
Reading Flow Trends
A single CFS number is a snapshot. The trend over the past 24-72 hours tells you where the river is headed.
Rising Water
What causes it: Snowmelt, rain events, dam releases, or upstream irrigation changes.
What it means for fishing:
- Fish often feed actively as rising water washes food into the drift
- However, rapidly rising water muddies quickly
- Trout may move to banks to escape heavy current and pick off terrestrials
What it means for floating:
- Increased difficulty and hazards
- Faster current reduces reaction time
- Debris in the water (logs, branches)
- Eddies may wash out, making rescue harder
The window: Some of the best fishing happens in the first 6-12 hours of a rise, before visibility drops. After that, wait for the river to stabilize.
Real example: Last summer I watched the Roaring Fork jump from 450 to 800 CFS after an afternoon thunderstorm in Aspen. The first two hours were incredible - trout hammering hoppers along the banks, probably taking advantage of bugs knocked into the water. By hour three, visibility was gone and so was the fishing. Next day at 650 CFS and falling? Best day of the summer.
Falling Water
What causes it: Runoff subsiding, storms passing, dam releases ending.
What it means for fishing:
- As visibility improves, fish begin feeding heavily
- Best window is often 14-18 inches of visibility (slightly off-color)
- Fish retreat toward deeper holds and mid-river as water drops
- Can be exceptional fishing as trout "make up for lost time"
What it means for floating:
- Conditions generally improving
- Watch for newly exposed rocks and obstacles
- Some rapids may become more technical as water thins
The window: The 24-72 hours after peak flow, as the river clears, often produces outstanding fishing.
Stable Water
What it means: Consistent conditions, predictable fishing.
Why it matters: Stable flows produce the most reliable fishing. Fish settle into patterns, feed at predictable times, and hold in expected locations. If you have limited time to fish, stable water gives you the best odds.
How CFS Affects Fish Behavior
Understanding how trout respond to different flows helps you find fish and choose tactics.
Low Flows
Conditions: Water is shallow, clear, and slow. Pools become critical holding areas.
Fish behavior:
- Trout concentrate in the deepest pools
- Extremely wary - they feel exposed
- Feed mostly at low-light periods (dawn, dusk)
- Spook easily from footsteps, shadows, and clumsy casts
Tactics:
- Long leaders and light tippet (5X-6X)
- Small flies that match naturals precisely
- Approach low and slow
- Focus on first and last light
Normal Flows
Conditions: River runs at typical levels with good depth variety.
Fish behavior:
- Trout disperse throughout available habitat
- Feed in riffles, runs, seams, and pools
- More aggressive than at low water
- Active during standard feeding windows
Tactics:
- Standard setups work well
- Cover water efficiently
- Multiple fly options remain viable
- Less critical to match the hatch precisely
High Flows
Conditions: Heavy current, reduced visibility, powerful water.
Fish behavior:
- Trout seek refuge from the main current
- Stack up against banks and behind structure
- Hold in soft water behind boulders and in eddies
- May feed opportunistically on large food that passes close
Tactics:
- Heavy nymphs and big streamers
- Fish tight to banks and structure
- Short drifts in slower water
- Heavier tippet (2X-3X)
Blown Out
Conditions: Visibility under 6 inches, dangerous current, chocolate milk color.
Reality check: The fishing is over. Don't force it. Either wait for conditions to improve or fish a different river. This is when you drive to that tailwater backup plan.
Safe Wading at Different Flows
Your ability to safely wade depends on flow, your experience, and river characteristics.
Before You Wade
- Check current CFS and compare to your comfort level
- Note whether flows are rising or falling
- Consider water temperature (cold water = hypothermia risk)
- Assess the specific section (width, bottom type, current speed)
General Guidelines
Rule of Thumb: If you're uncomfortable, don't wade. Your instincts exist for a reason.
Safe wading practices:
- Use a wading staff for stability and probing depth
- Keep your wading belt cinched tight (slows water entry if you fall)
- Never cross your feet - shuffle sideways
- Look for footholds between rocks, not on top of them
- Wade with a partner in tricky water
- If you feel yourself losing balance, don't fight it - sit down and float feet-first to shore
When to Stop
- Current pushes you sideways despite bracing
- Water reaches mid-thigh or higher
- You can't see your feet
- Visibility is less than 12 inches
- You feel uneasy for any reason
A Lesson in Humility
A few years back on the Eagle River, the gauge showed 380 CFS - well within "wadeable" range for that water. But I'd forgotten to check the trend. Turns out it had been 180 CFS the day before and was rising fast after thunderstorms upstream.
Halfway across a run I'd crossed easily a dozen times, I felt the bottom shift. The current grabbed my legs in a way it never had before. I barely made it back to the bank I'd started from, soaked to the waist, heart pounding.
The number was "safe." The trend wasn't. Now I check both, every time.
Reading Flow Charts
Flow charts pack a lot of information into a small space. Here's how to extract what matters.
The Basic Chart
Most flow charts show:
- X-axis: Time (hours, days, or longer periods)
- Y-axis: CFS or gauge height
- Current reading: The most recent data point
- Trend line: Shows direction (rising, falling, stable)
What to Look For
Recent trend (past 24-48 hours):
- Is the line going up, down, or flat?
- How quickly is it changing?
- Any sudden spikes or drops?
Comparison to normal:
- Where is current flow relative to the historical median?
- Is this typical for the season?
Pattern recognition:
- Daily fluctuations often indicate dam releases
- Sudden spikes usually mean rain events
- Gradual seasonal curves indicate snowmelt patterns
Interpreting Patterns
Sawtooth pattern: Dam releases create predictable daily fluctuations. Learn the timing - flows may be ideal in the morning and too high by afternoon.
Smooth rise: Snowmelt produces gradual, predictable increases through late spring. Watch for the peak, then fish the falling water.
Spike and drop: Rain events cause rapid rises followed by faster drops. Wait for the falling limb and improving visibility.
Flat line: Stable conditions, often below dams in summer. Predictable fishing.
Real Chart Examples
Learning to read flow charts is easier with real examples. Here are seven common patterns you'll encounter on RiverReports, each telling a different story about what's happening on the water.
Example 1: The Flat Line (Stable Tailwater)
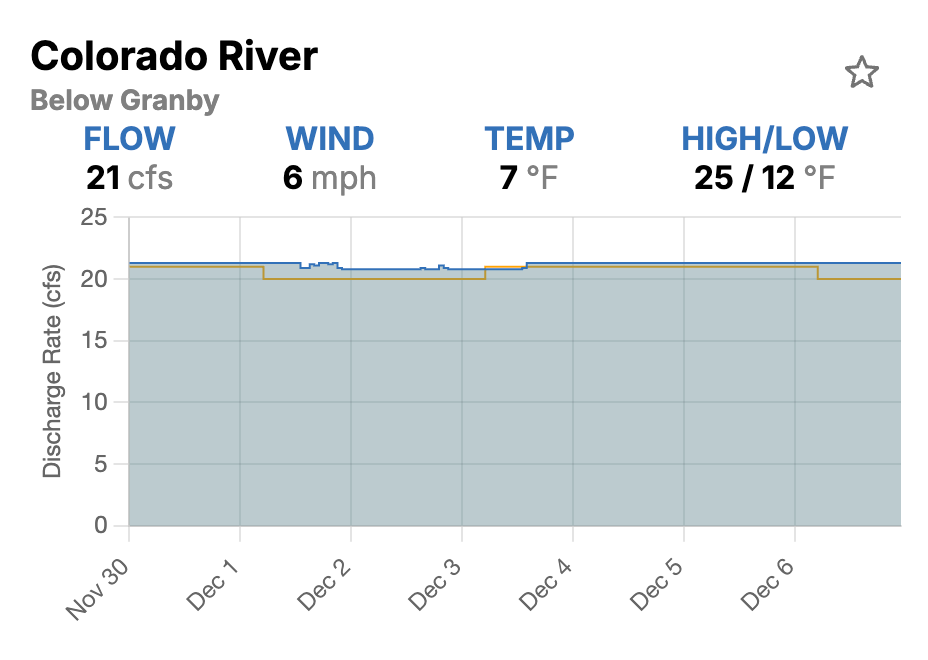
What you're seeing: The Colorado River below Granby running at a rock-steady 21 CFS. The blue line (current flow) barely moves over the entire week, hugging the orange line (historical median).
What it means: This is classic tailwater behavior - dam-controlled flows with minimal variation. The river is running right at historical norms.
Fishing implications: Predictable conditions. Fish will be in their usual spots, feeding on their usual schedule. No need to adjust tactics day-to-day. At 21 CFS, this is very low water - approach carefully and use light tippet.
Example 2: The Spike and Drop (Rain Event)
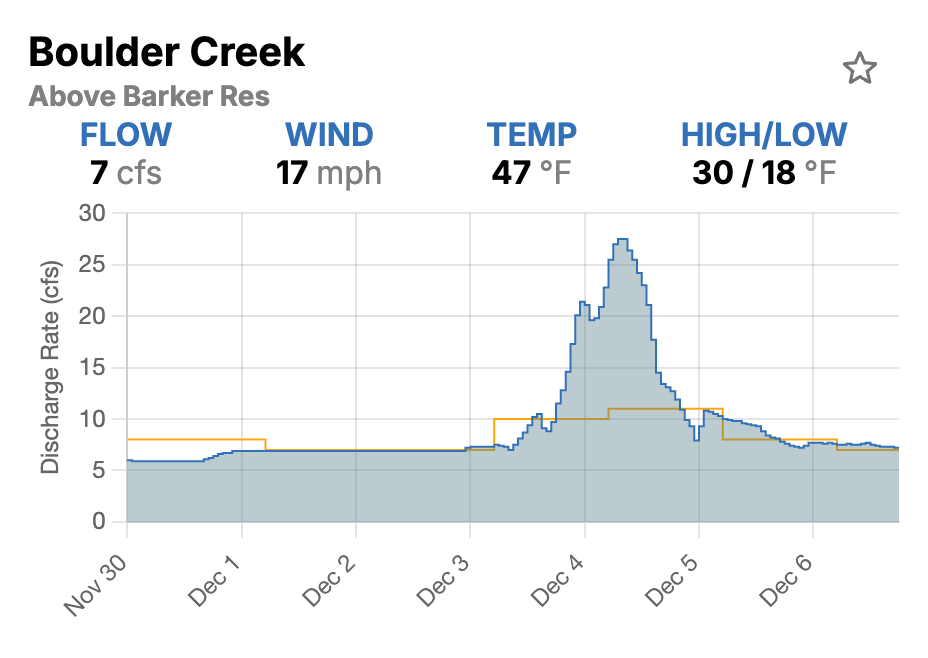
What you're seeing: Boulder Creek spiked from 7 CFS to nearly 28 CFS on December 4th, then dropped back down over the following days. Currently at 7 CFS.
What it means: A rain or snowmelt event caused a rapid rise, followed by an equally rapid drop. The orange median line shows this spike was well above normal conditions.
Fishing implications: The spike itself was likely unfishable - too fast, too dirty. But look at where it is now: back down to 7 CFS and falling. This is the "clearing window" when fish start feeding aggressively after being hunkered down. If you'd checked this chart on December 5th or 6th, you'd have found excellent conditions as the creek cleared.
Example 3: The Daily Rhythm (Diurnal Pattern)
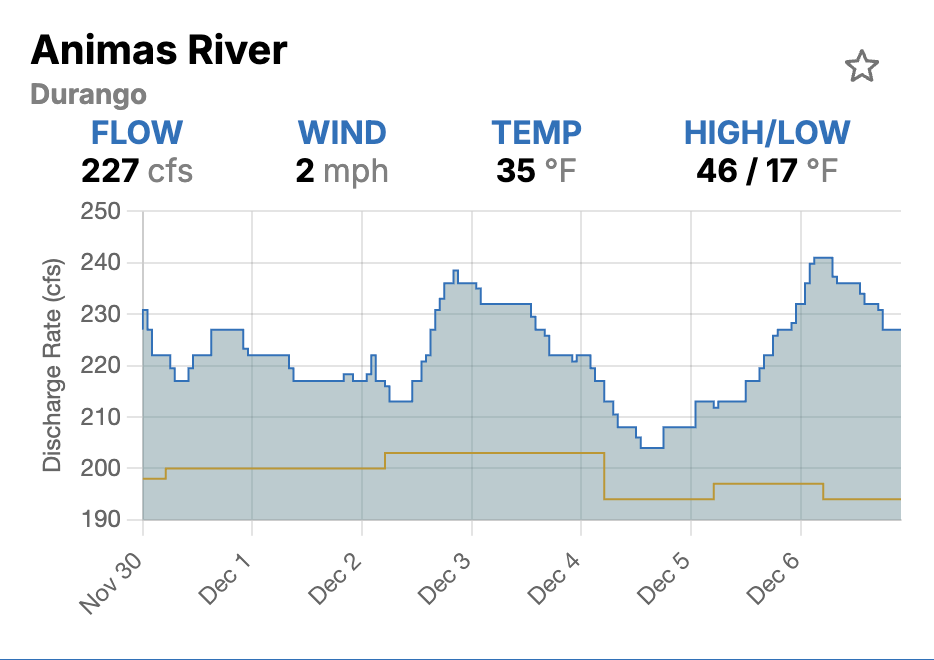
What you're seeing: The Animas River showing a repeating up-and-down pattern - rising during the day, falling at night, with peaks around 235-240 CFS and valleys around 210-215 CFS.
What it means: This diurnal (daily) pattern is caused by snowmelt. As temperatures warm during the day, snow melts faster, increasing flow. Overnight, temperatures drop and flow decreases. The pattern repeats predictably.
Fishing implications: Time your fishing to the pattern. Early morning (before the daily rise) often offers the best conditions - lower, clearer water. By afternoon, flows are higher and potentially muddier. The orange median line shows current flows are slightly above historical average - the river is running a bit high but within normal range.
Example 4: The Dramatic Rise (Weather Event)
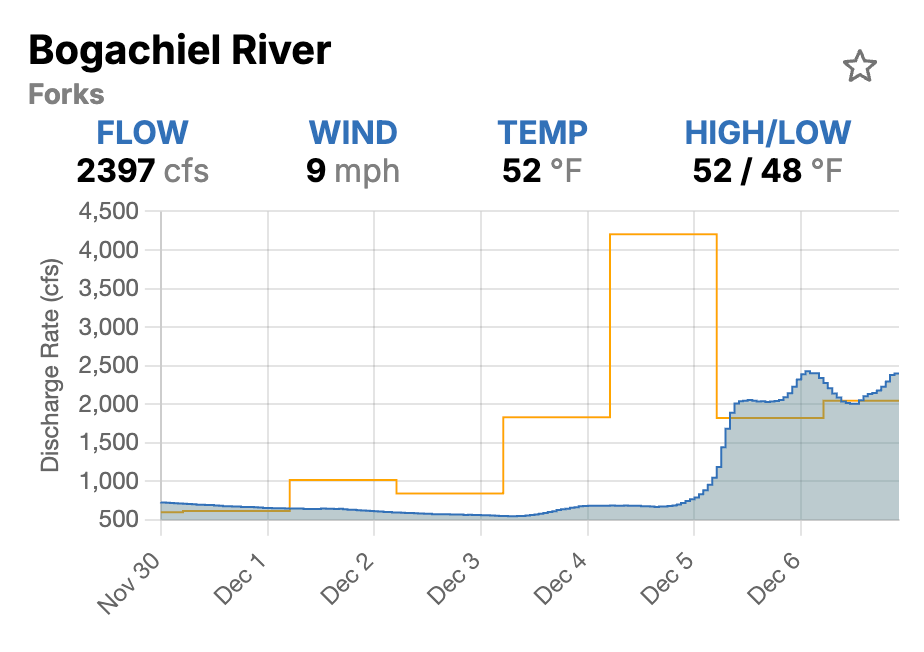
What you're seeing: The Bogachiel River jumped from around 600 CFS to nearly 2,400 CFS in just two days (December 4-6). The orange median line shows what "normal" looks like - and this is way above it.
What it means: A significant weather event - heavy rain in the Pacific Northwest. The river went from running well below median to well above it in 48 hours.
Fishing implications: This river was fishable on December 3rd and early December 4th. By December 5th, it was blown out. Looking at this chart, you'd want to wait several more days for flows to drop back toward the 1,000-1,500 CFS range before planning a trip. The good news: it appears to be cresting and may start falling soon.
Example 5: Running Below Median (Drought/Low Water)
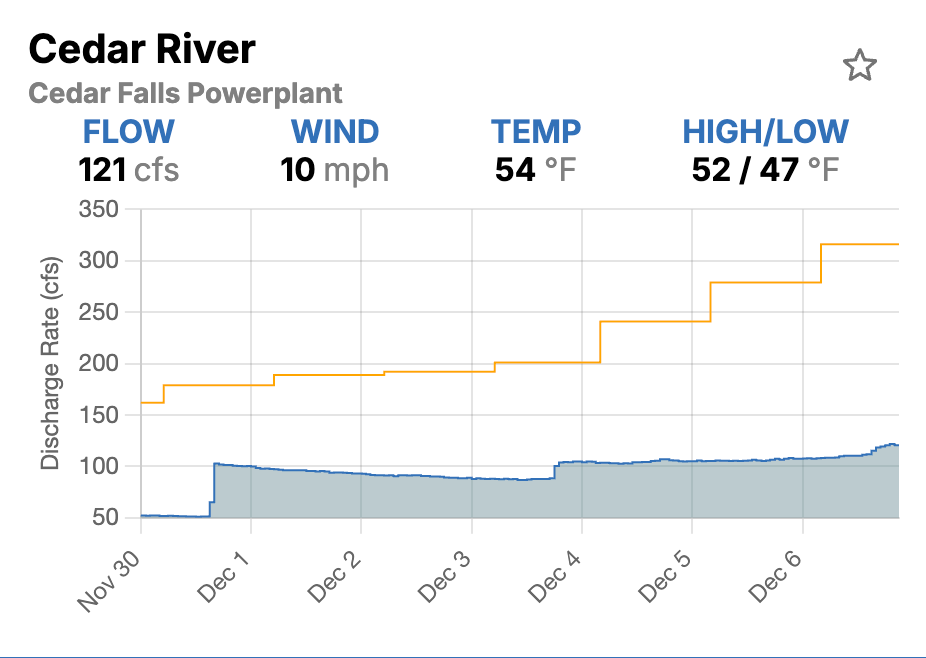
What you're seeing: The Cedar River running at 121 CFS while the historical median (orange line) shows it should be around 300+ CFS. The current flow line is consistently well below the median.
What it means: This river is running significantly below normal - only about 40% of what's typical for this time of year. This could indicate drought conditions, upstream water management, or an unusually dry season.
Fishing implications: Low water means technical fishing. Fish will be concentrated in deeper pools and very wary. Use long leaders, light tippet, and careful approaches. The flip side: you can wade water that's normally too deep, accessing spots that are usually unreachable. Best fishing will be early and late in the day when fish feel safer feeding.
Example 6: The Sawtooth (Dam Releases)
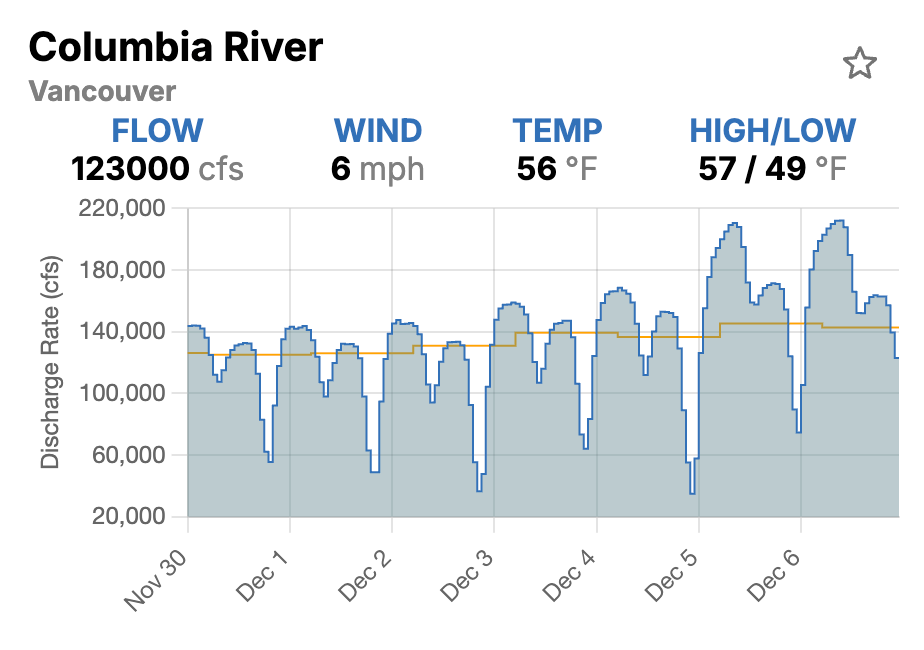
What you're seeing: The Columbia River showing a dramatic sawtooth pattern - sharp daily drops from ~140,000 CFS down to as low as 30,000 CFS, then back up. This repeats every day.
What it means: Classic hydroelectric dam operations. Power demand fluctuates throughout the day, so dam releases vary accordingly. The drops represent reduced releases; the peaks represent maximum generation.
Fishing implications: On dam-controlled rivers with this pattern, timing is everything. Those low points (the valleys in the sawtooth) often represent the best fishing windows - lower water, less current, fish more accessible. Learn the timing of releases on your local tailwater. Some anglers plan their entire day around the release schedule.
Example 7: The Gradual Drop (Post-Runoff/Clearing)
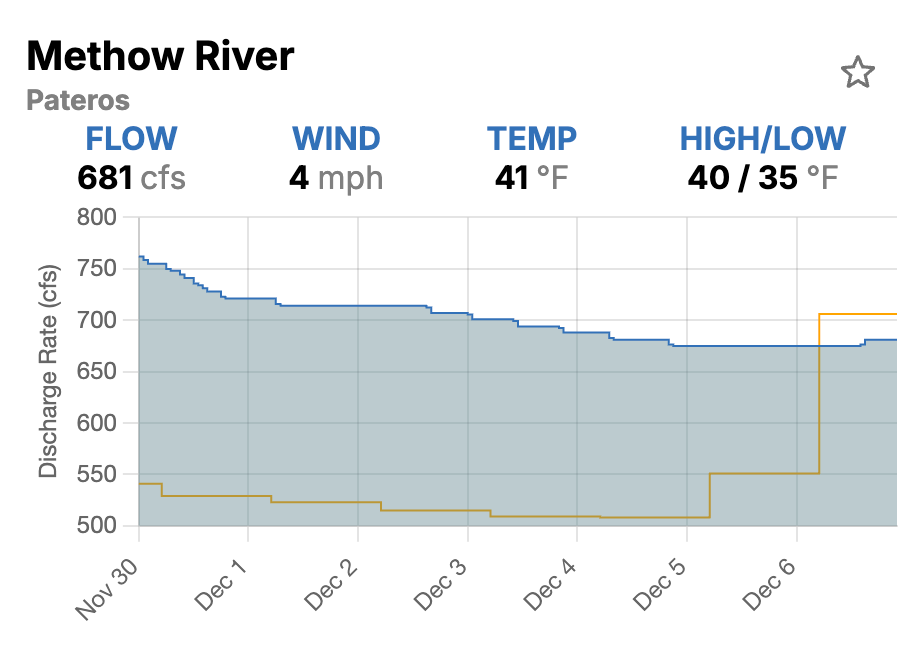
What you're seeing: The Methow River showing a steady, gradual decline from about 760 CFS to 680 CFS over the week. The blue line is consistently above the orange median, but the gap is closing.
What it means: The river is settling down after higher flows, gradually returning toward normal levels. This is the kind of pattern you see after runoff peaks or after a weather event passes.
Fishing implications: This is often prime time. Falling water with improving clarity triggers feeding activity. Fish that were hunkered down during higher flows start moving and eating aggressively. If you see this pattern, get on the water - especially when flows are about 10-20% above median and dropping. The fish know conditions are improving and they're hungry.
Key Takeaways from These Examples
-
The orange line is your friend - it shows what's "normal" so you can judge whether current conditions are high, low, or typical
-
Trends matter more than snapshots - a river at 500 CFS and rising tells a very different story than 500 CFS and falling
-
Learn to spot patterns - sawtooth = dam releases, daily rhythm = snowmelt, spike and drop = rain event
-
Timing opportunities - falling water after a spike, early morning before daily rises, valleys in the sawtooth pattern
-
Context is everything - 21 CFS is normal for the Colorado below Granby but would be a drought emergency on the Madison
Seasonal Patterns
River flows follow predictable annual cycles. Understanding these patterns helps you plan trips months in advance.
Western Freestone Rivers
Winter (Dec-Mar):
- Flows at annual minimums
- Water is cold and clear
- Fish are sluggish but present
- Low-flow techniques required
Spring Runoff (Apr-Jun):
- Snowmelt causes dramatic flow increases
- Rivers often unfishable for weeks
- Peak timing varies by elevation and snowpack
- Watch for the "window" between ice-out and full runoff
Post-Runoff (Jun-Jul):
- Flows drop and clear
- Often the best fishing of the year
- Watch for major hatches (Salmonflies, Golden Stones)
- Wading becomes possible again
Summer (Jul-Sep):
- Flows stabilize at moderate levels
- Water temperatures rise - watch for Hoot Owl restrictions
- Afternoon thunderstorms cause temporary spikes
- Early morning and evening fishing often best
Fall (Sep-Nov):
- Flows drop to winter baselines
- Water clears and cools
- Brown trout spawn (handle with care)
- Excellent dry fly fishing
Using RiverReports Effectively
RiverReports makes flow checking simple, but a few strategies will help you get even more out of it.
Setting Up Your Favorites
Track the rivers you fish most. Add them to your favorites for quick access:
- Colorado rivers: Browse Colorado flows
- Montana rivers: Browse Montana flows
- Idaho rivers: Browse Idaho flows
- Utah rivers: Browse Utah flows
Pre-Trip Planning
One week out:
- Check current flows and compare to seasonal medians
- Note any weather systems that might affect conditions
- Have backup options if your primary river runs high (consider a tailwater)
24 hours before:
- Check latest readings
- Note the trend (rising, stable, falling)
- Check water temperature if available
- Adjust your plan based on conditions
Morning of:
- Final check before leaving
- Consider packing for multiple scenarios
On the Water
Download the RiverReports app for mobile access. You can check flows even at the river to:
- Decide whether to wait out rising water
- Determine if another section might be better
- Monitor for dam releases or weather-related changes
Learning Your Rivers
Keep a simple log:
- Date, river, section
- CFS at time of fishing
- Water temperature
- Conditions (clarity, difficulty, fish activity)
- Notes on what worked
After a season, you'll have personalized flow ranges for your favorite waters. This notebook becomes more valuable than any guide.
Common Mistakes
Trusting the Number Without Context
"The gauge says 500 CFS, so we're good."
This only works if you know what 500 CFS means on that specific river. The South Platte at 500 CFS is blown out. The Yellowstone at 500 CFS is practically dry. Always compare to historical data and your own experience.
Ignoring the Trend
A river at 800 CFS and rising is very different from 800 CFS and falling. The trend tells you where conditions are headed.
Fishing Blown-Out Water
Visibility matters more than flow. You can catch fish at surprisingly high flows if the water is clear. You can't catch fish at moderate flows if visibility is zero.
Assuming Gauge Location = Fishing Location
The gauge might be 20 miles from where you're fishing. Tributary inputs, diversions, and gradient changes all affect local conditions. The gauge reading is a reference point, not an exact description of your water.
Ignoring Temperature
Summer anglers who only check CFS miss a critical variable. A river at "perfect" flows and 72°F water temperature isn't perfect - it's a place where you might kill fish you catch.
Waiting for "Perfect" Conditions
Perfect conditions exist maybe 20% of the time. Good anglers learn to catch fish across a range of conditions. Use flow data to inform your tactics, not just to decide whether to go.
Putting It All Together
Here's a practical workflow for using flow data:
Step 1: Check Current Conditions
- What is the CFS reading?
- How does it compare to seasonal median?
- What's the trend over the past 24-48 hours?
- What's the water temperature?
Step 2: Assess Your Activity
- Wading? Check if flows are safe for the section
- Floating? Verify minimum and maximum runnable flows
- Both? Identify which sections will work
Step 3: Adjust Tactics
- Low water: Light tippet, small flies, careful approach
- Normal: Standard setups, cover water efficiently
- High water: Heavy nymphs, streamers, target banks
Step 4: Have a Backup
- If your primary river is blown out, where else could you go?
- Is a tailwater nearby running fishable?
- Could you fish a smaller tributary that cleared faster?
Step 5: Stay Flexible
- Conditions change. Check again before you leave.
- On multi-day trips, be ready to move if conditions shift.
- If temperatures spike, plan to be off the water by early afternoon.
Resources
Learn Your Home Waters
The only way to truly understand what CFS means on a specific river is to fish it at different levels. Keep notes, pay attention, and build your own knowledge base. After a few seasons, you'll instinctively know what 400 CFS on your home water looks and feels like.
Local Fly Shops
Shops track conditions daily and can tell you what's fishing well right now. A quick phone call often provides better intel than any website. They know about that gauge that reads 50 CFS high, or the diversion that changes everything above the canyon.
Track Flows on RiverReports
- Colorado Rivers - Arkansas, South Platte, Colorado, Gunnison, and more
- Montana Rivers - Madison, Yellowstone, Missouri, Big Hole, Bighorn, and more
- Idaho Rivers - Henry's Fork, South Fork Snake, Salmon, and more
- Utah Rivers - Green, Provo, Weber, and more
- All States - Find flows across the country
Download the app for mobile access when you're on the road or streamside.
River Intel Weekly
Weekly flow updates and fishing intel.
© 2026 RiverReports, Inc.